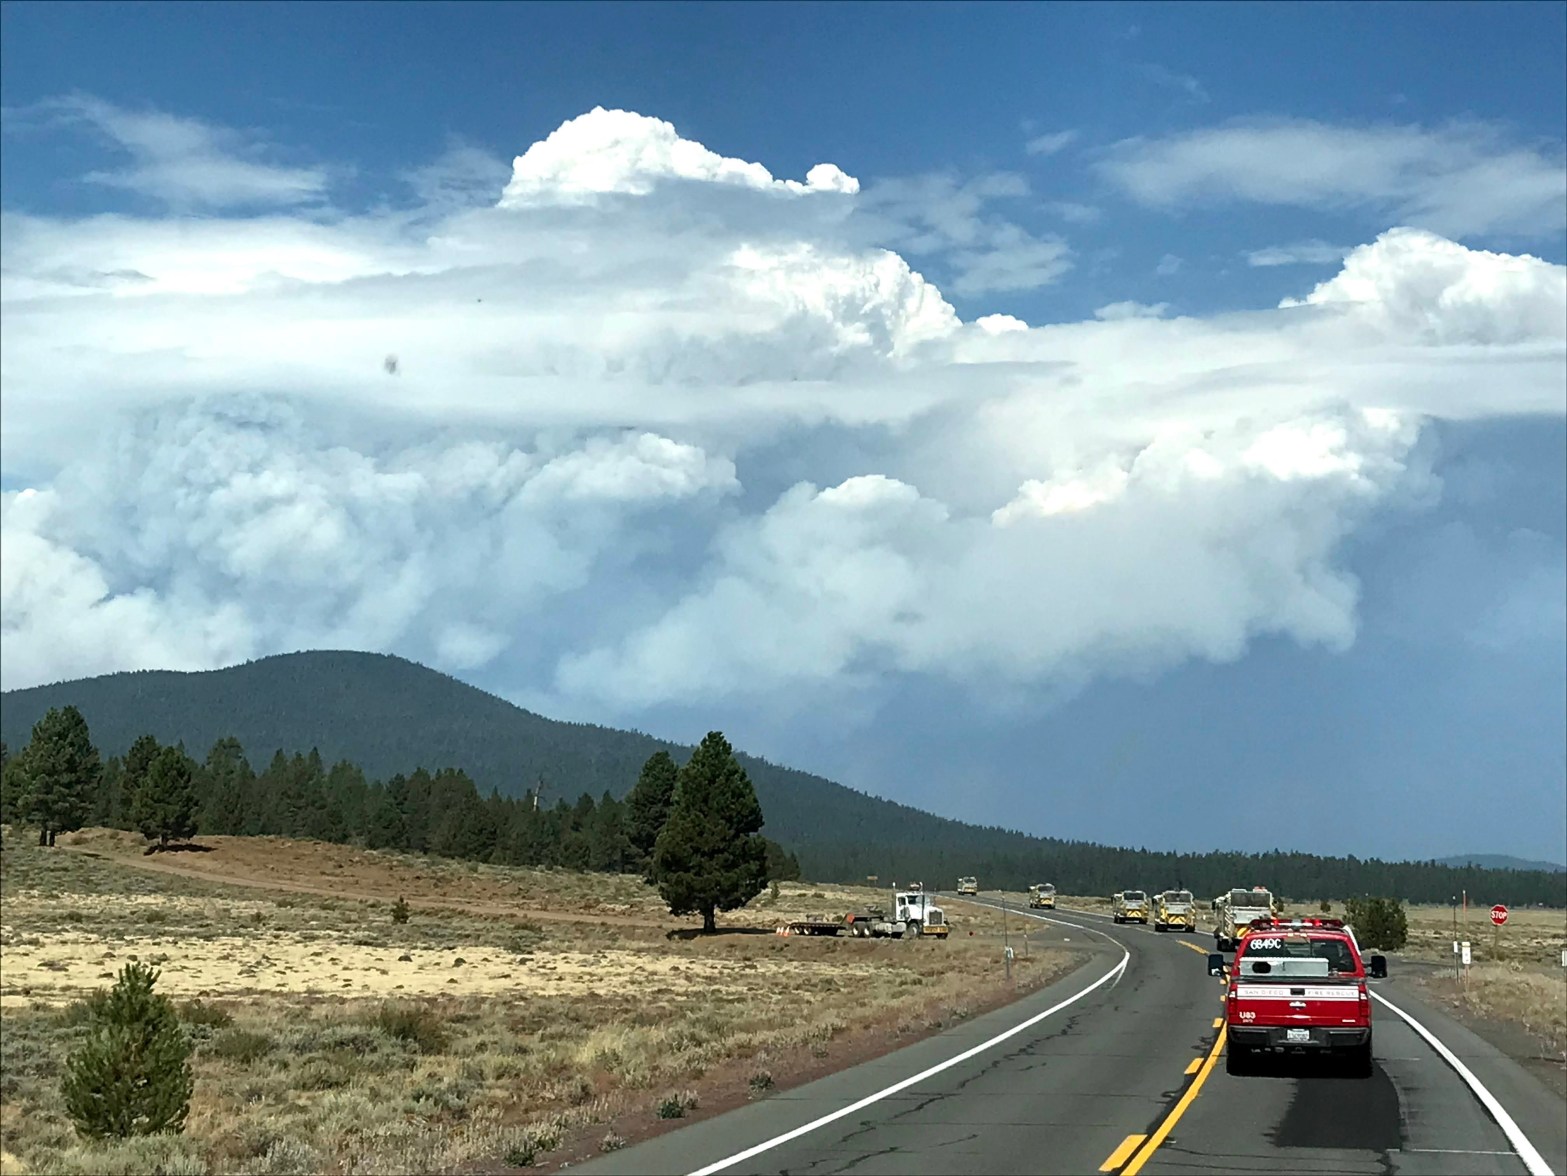
On the news, watching a wildfire devour the wilderness is an awe-inspiring sight. Some days, the fire takes on the life of a Kenyan marathon runner, steadily running through the timber canopy and undergrowth in a steady march of destruction. Despite an army of strike teams, hand crews, air tankers, dozers and helicopters, it pushes forward swiftly without mercy. It is relentless in jumping containment lines. Driven by fuel, weather and topography in perfect alignment, it shoots embers that start smaller fires miles ahead of the main fire front. And then without warning, abruptly it slows. It gives attack crews the upper hand to protect life, property and the environment. It creeps benignly across the ground harmlessly. And then it surges ahead. Lather rinse repeat…we hope that when the unstoppable fire front slows, we can catch it and contain it before it turns into a batshit crazy inferno hell bent on vaporizing any town that lays in its path.
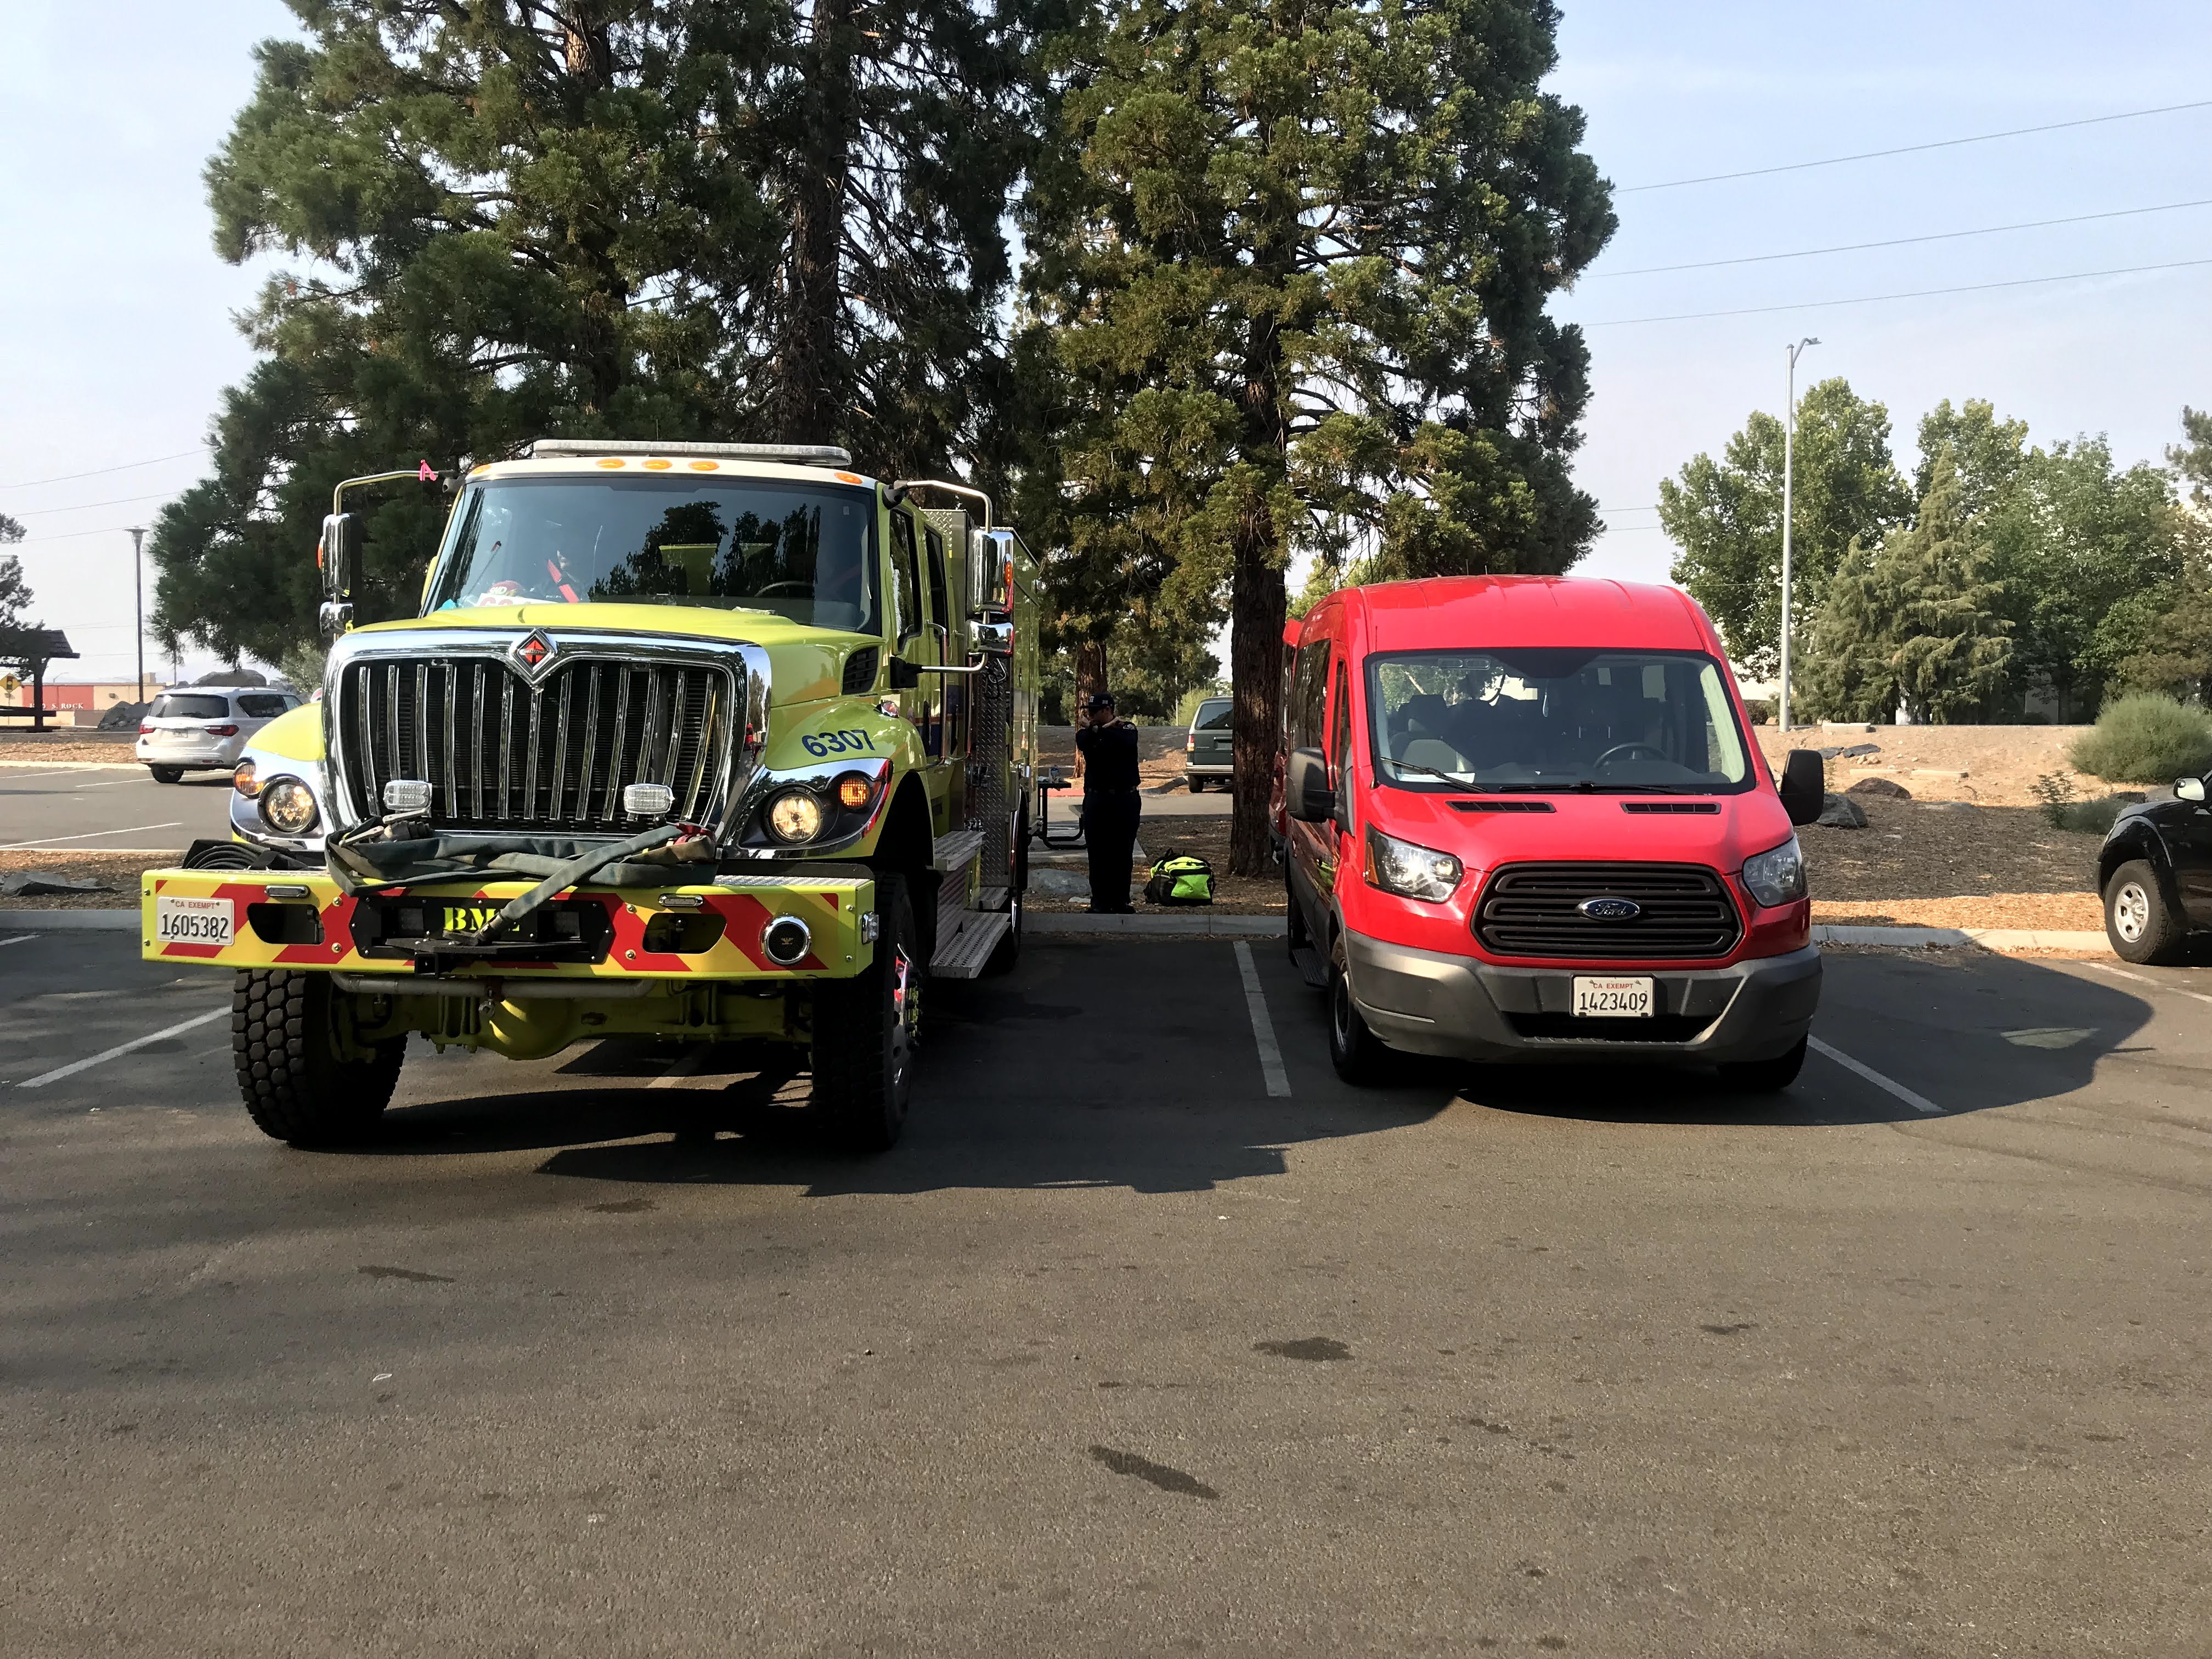
We are still in the thick of fire season, and major fires like the Dixie and Caldor fires have been burning for months and are still not fully contained. Many crews have been working the fires so long that they keep the apparatus at the incident, but swap personnel so that fresh firefighting teams can rotate in and battered crews can get a few days or weeks of reprieve. During such crew swaps, valuable information is swapped about fire conditions. The rotations our agency uses for crew swaps are on a two week basis and I think focusing on the crew turnovers is a perfect example of how to highlight the concept of compound annual growth rate.
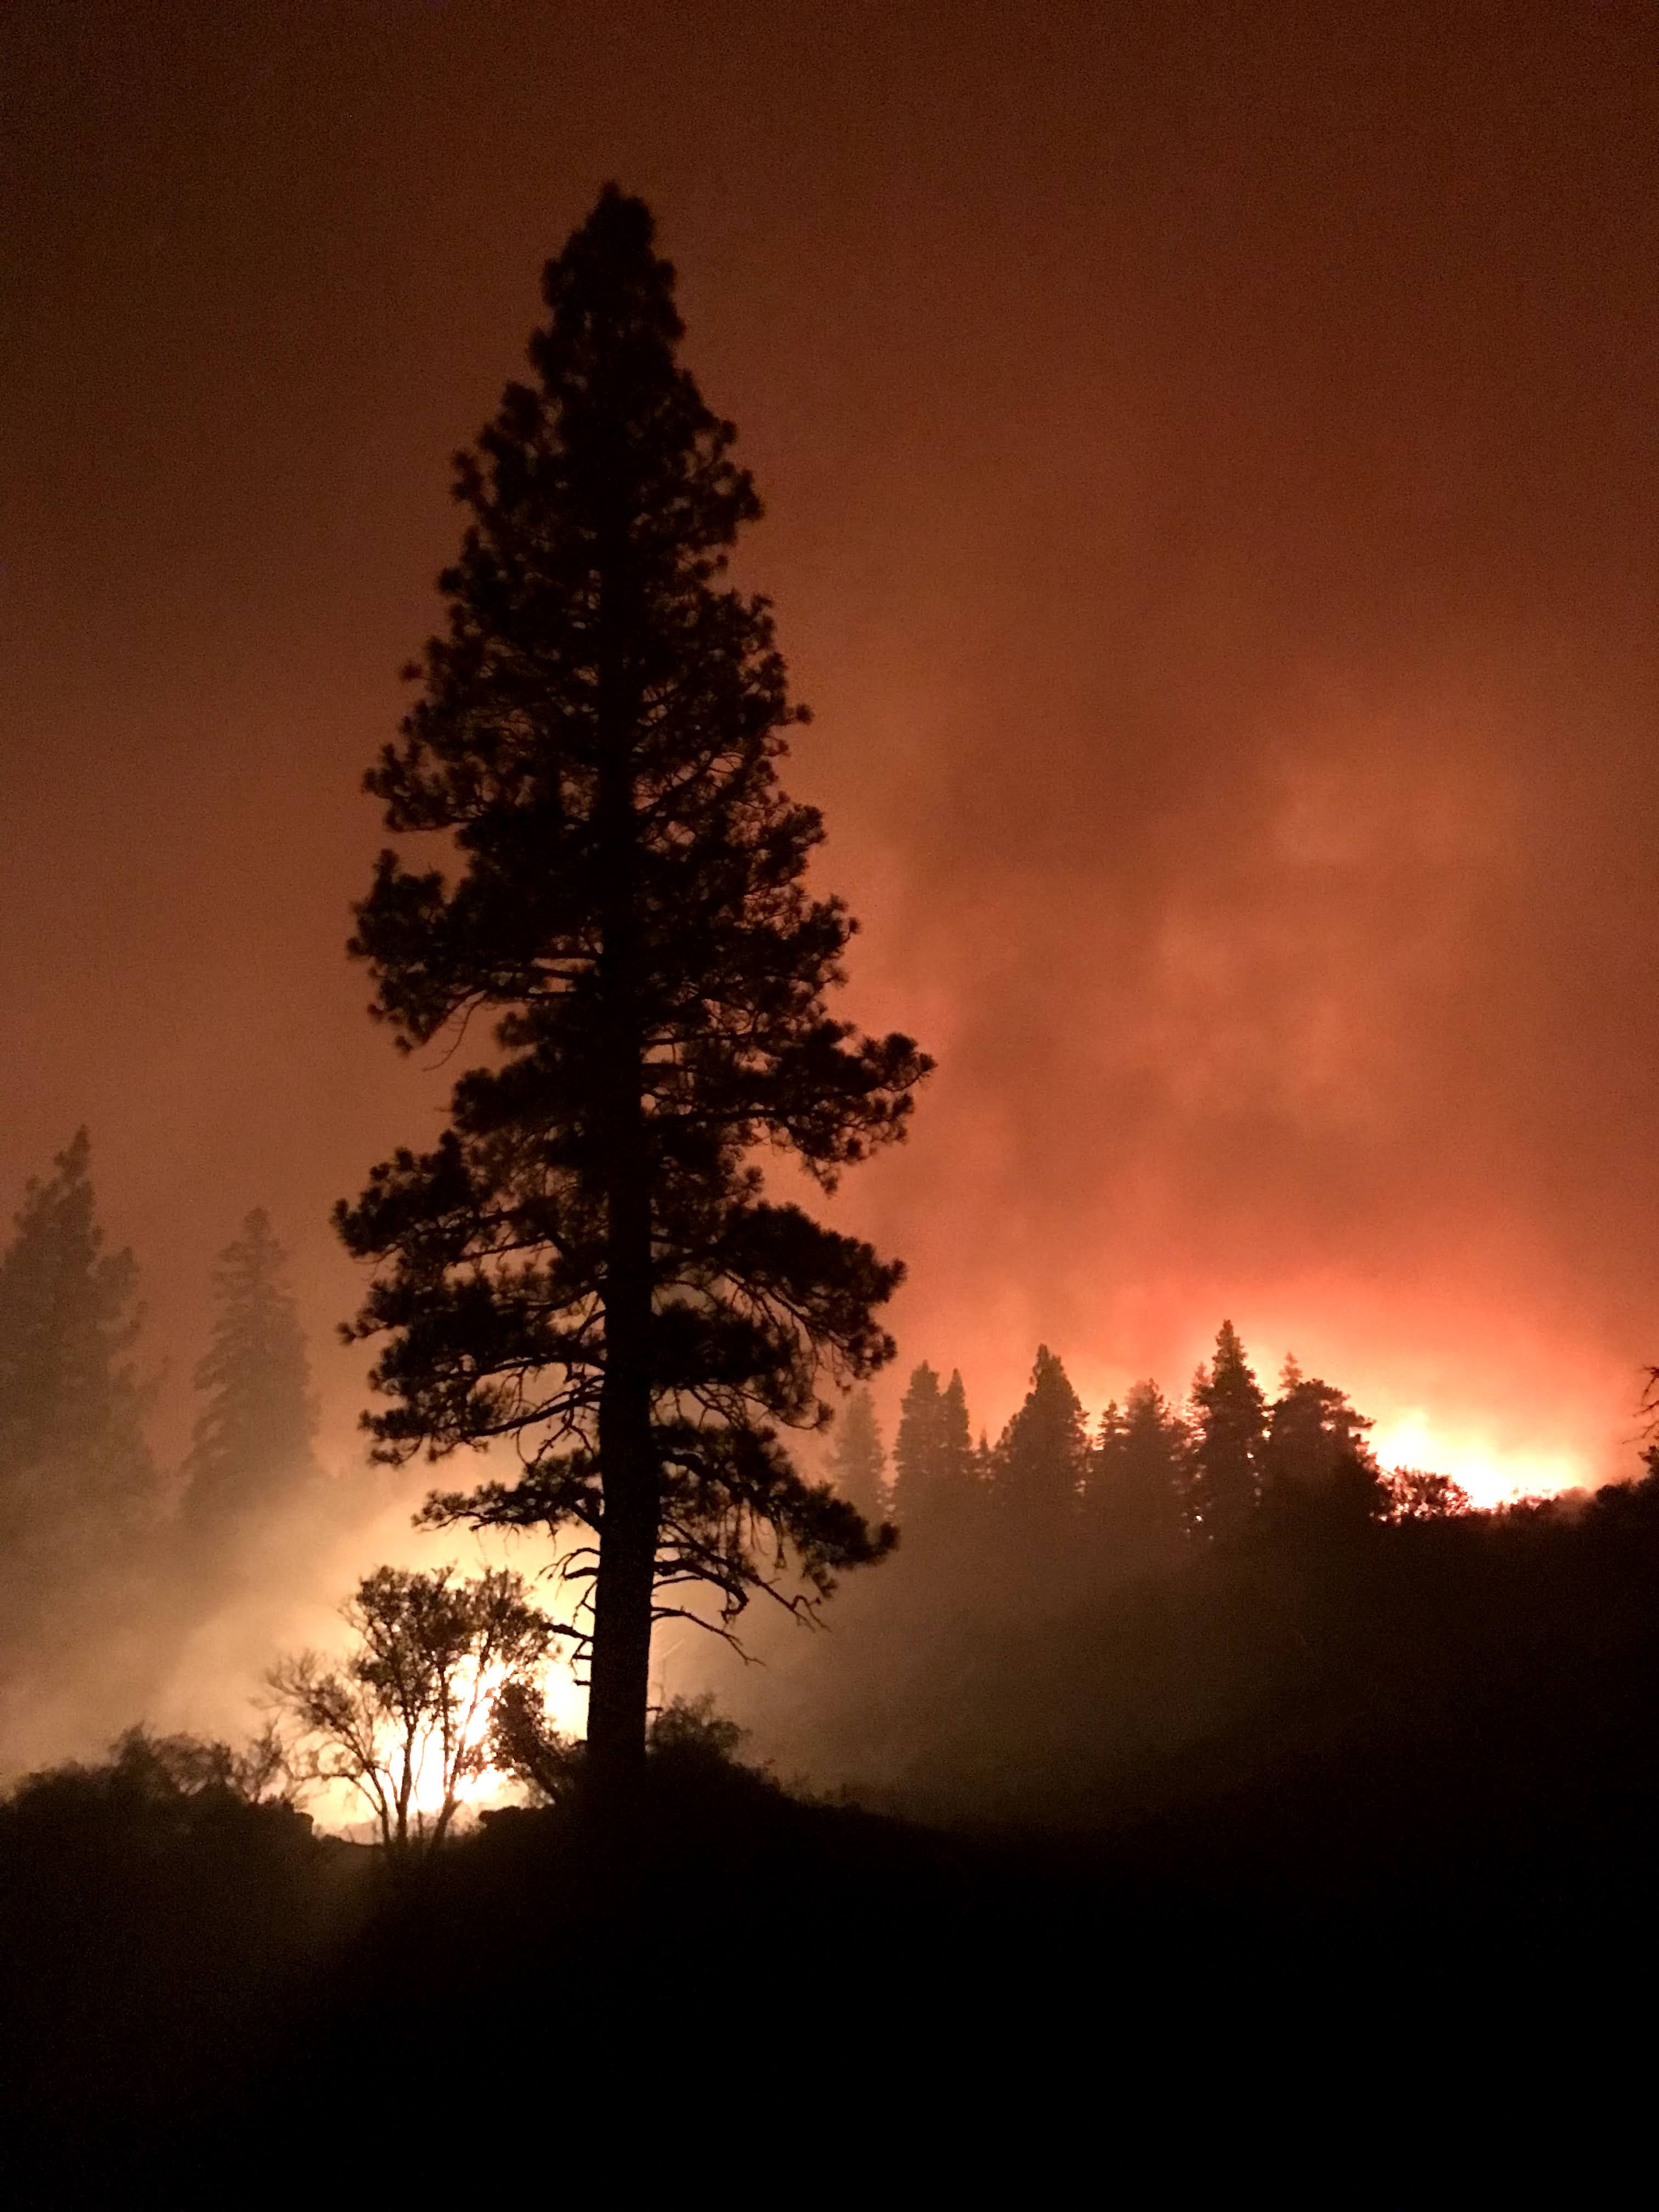
I am going to give a generalized example of a major campaign style fire. On this incident, the first arriving crews are in the initial attack phase of the fire. It is roughly fly by the seat of your pants (of course being as safe as possible) tactics aimed at trying to stop a freight train of destruction. If the fire can’t be stopped, you typically will see a transition into a campaign style fire. Lots of resources get ordered up and they are organized an intricate command structure that seeks to deliberately and safely control the chaos. By the time your two weeks are up, your turnover to the oncoming crew might be summed up as “Be careful, this fire is crazy and we saw a lot of dangerous fire conditions.” Not always, but more likely. That oncoming crew will most likely be reporting to an incident that is managed by an incident management team with more adequate resource staffing levels and a clearer plan of attack. Thus, you could reasonably anticipate the two weeks of that assignment to be more benign. Not always, but the odds are if you have more resources and are better organized, you will be more successful and safer in fire attack. So, if the incident extends past the next two weeks, you may have another turnover with a fresh crew. You might tell that crew “We put in a lot of containment work and this fire is almost out. This might be a two-week grind of tedious mop up work.” But then a massive weather front moves in and a dying fire is brought back to life and the crews that expected to be putting out smoldering logs in the middle of the forest are in for a wild ride. You just never know on these fires how each two week assignment will go, but each two week rotation has an overall feel of how effective the firefighting operations are going and that sentiment changes each two week change out period.
When the incident is done, how do we describe the growth and destruction of such a fire?
The initial attack strike team will look back on that fire behavior as some of the most explosive growth they have ever seen! The team that rotated in the middle will feel neutral on the matter, and the third rotation team will be swapping war stories with the initial attack team. So who do you listen to when you want to know how fast the fire grew? What happens if you are an agency tasked with reporting on every fire in the state? There are hundreds of smaller wildfires every season. If you are responsible for measuring those, how do you compare each one? Let’s pivot to the financial world. There are hundreds of thousands…scratch that, infinite amounts of investment opportunities, each with their own associate boom and bust cycles. Some such as crypto and commodities have more pronounced ups and downs than others such as bonds and real estate. How can we reliably measure the success or failure of each in terms that make the easier to compare? The answer lies in Compound Annual Growth Rate.
Compound Annual Growth Rate
I’m speaking in broad terms, but all of these wildfires ultimately start with a point of ignition, burn in various bursts and lulls of spreading and then either burn out or are contained to a point where the thermal energy left poses zero risk to sustain ignition. There is a start and a finish, with a roller coaster of growth and decay in the middle. Similarly, all investments can be analyzed accordingly from one point in time to another with various boom and bust phases in between. Compound Annual Growth Rate, or CAGR for short, seeks to start at the ending point and work backwards to the start point by reversing engineering the concept of compounding interest. The end product is your compounding annual growth rate. This gives you a generalized picture of how well an investment has done over a period of time while ignoring the wild ride of ups and downs in between. When you line up investments under the same periods of time, you can compare CAGR results to make better financial decisions.
Limitations
CAGR is best used for longer term investments. If you are studying an asset over time, the longer time frame you have, the better picture you have of the performance and the larger boom and bust cycles are smoothed out into a broader trend. Looking at the stock market as a prime example, through all the large financial crises over time, the market has steadily marched upwards. If your investment strategy is over a longer time span, CAGR is an incredibly useful tool that might have helped you sleep better at night during the global financial crisis of 2008-2009. If you are day trading or swing trading the stock market or flipping homes, you could care less about long term annualized results and instead are trying to capitalize on the violent swings up and down in the market in order for you to make a quick buck. In the fire world, you could care less that the small brush fire in your backyard wildland urban interface only burned 200 acres over the course of two days if your crew almost got burned over. At the end of the year, your small fire was barely a blip on the states radar of significant incidents, but the volatility of the incident may keep you up at night sweating your chosen strategies and tactics.
Application To The Pension Fund
Pension funds have the incredible burden of needing to provide a reliable source of income for its retirees. To maintain the fund, pension fund managers home in on the CAGR of time tested assets. Many times, members bemoan the fact that the index fund in their 401(k) accounts are netting 18% returns this year compared to the pension fund’s paltry 7%-8%. At face value this does seem preposterous! Why shouldn’t we invest all of our assets in the index funds instead of a mix of assets that only net a total half as much. It is very short sighted. Yes, the past decade has been kind to Wall Street, but historically, the CAGR is far below the 18% that the S&P 500 is pumping out today. Gains of 18% this year could be met with losses of who knows what next year. All investment strategies can and will change with time, but the responsibility of maintain the financial well being of thousands of retirees is not something to gamble around with.
